War, Oil and Your Home — What 50 Years of Data Actually Shows
The US is at war with Iran. Oil prices are rising. We analysed 50 years of Gold Coast house prices across five oil shocks to find out what actually happens — and what matters more than the oil price.

The United States is at war with Iran. Oil prices are climbing. Headlines are getting louder. And if you own property on the Gold Coast — or you are thinking about buying — the question forming in the back of your mind is a reasonable one: should I be worried?
We went looking for the answer in the data. Fifty years of actual price history across Gold Coast suburbs, measured against every major oil shock since 1973.
Here is what we found.
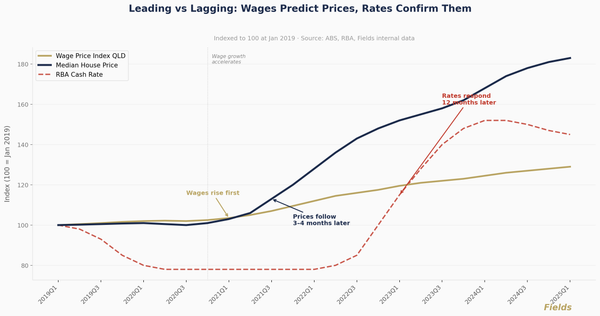
The Chain That Has to Break
Oil shocks do not directly affect house prices. There is a transmission chain, and every link has to hold for the shock to reach your front door:
Oil price spike → petrol and energy costs rise → consumer prices rise (inflation) → the RBA raises interest rates → your borrowing capacity falls → fewer buyers can compete → prices soften.
That is five steps. In most historical oil shocks, the chain breaks somewhere along the way. The oil price spikes, inflation ticks up, the RBA holds steady or responds moderately, and property markets carry on largely unaffected.
The question is never “what will oil do?” It is “will the RBA be forced to raise rates aggressively?” That is where the data points.
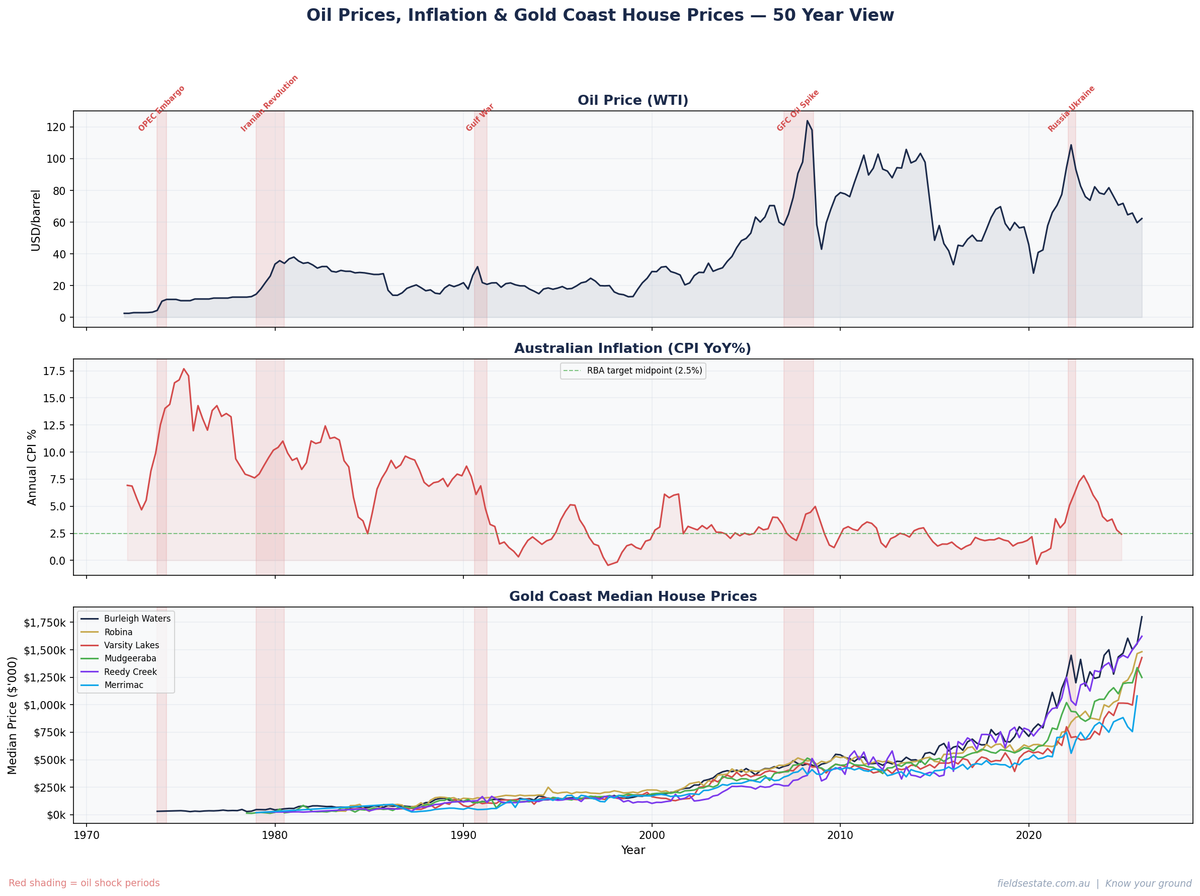
Five Oil Shocks, Five Different Outcomes
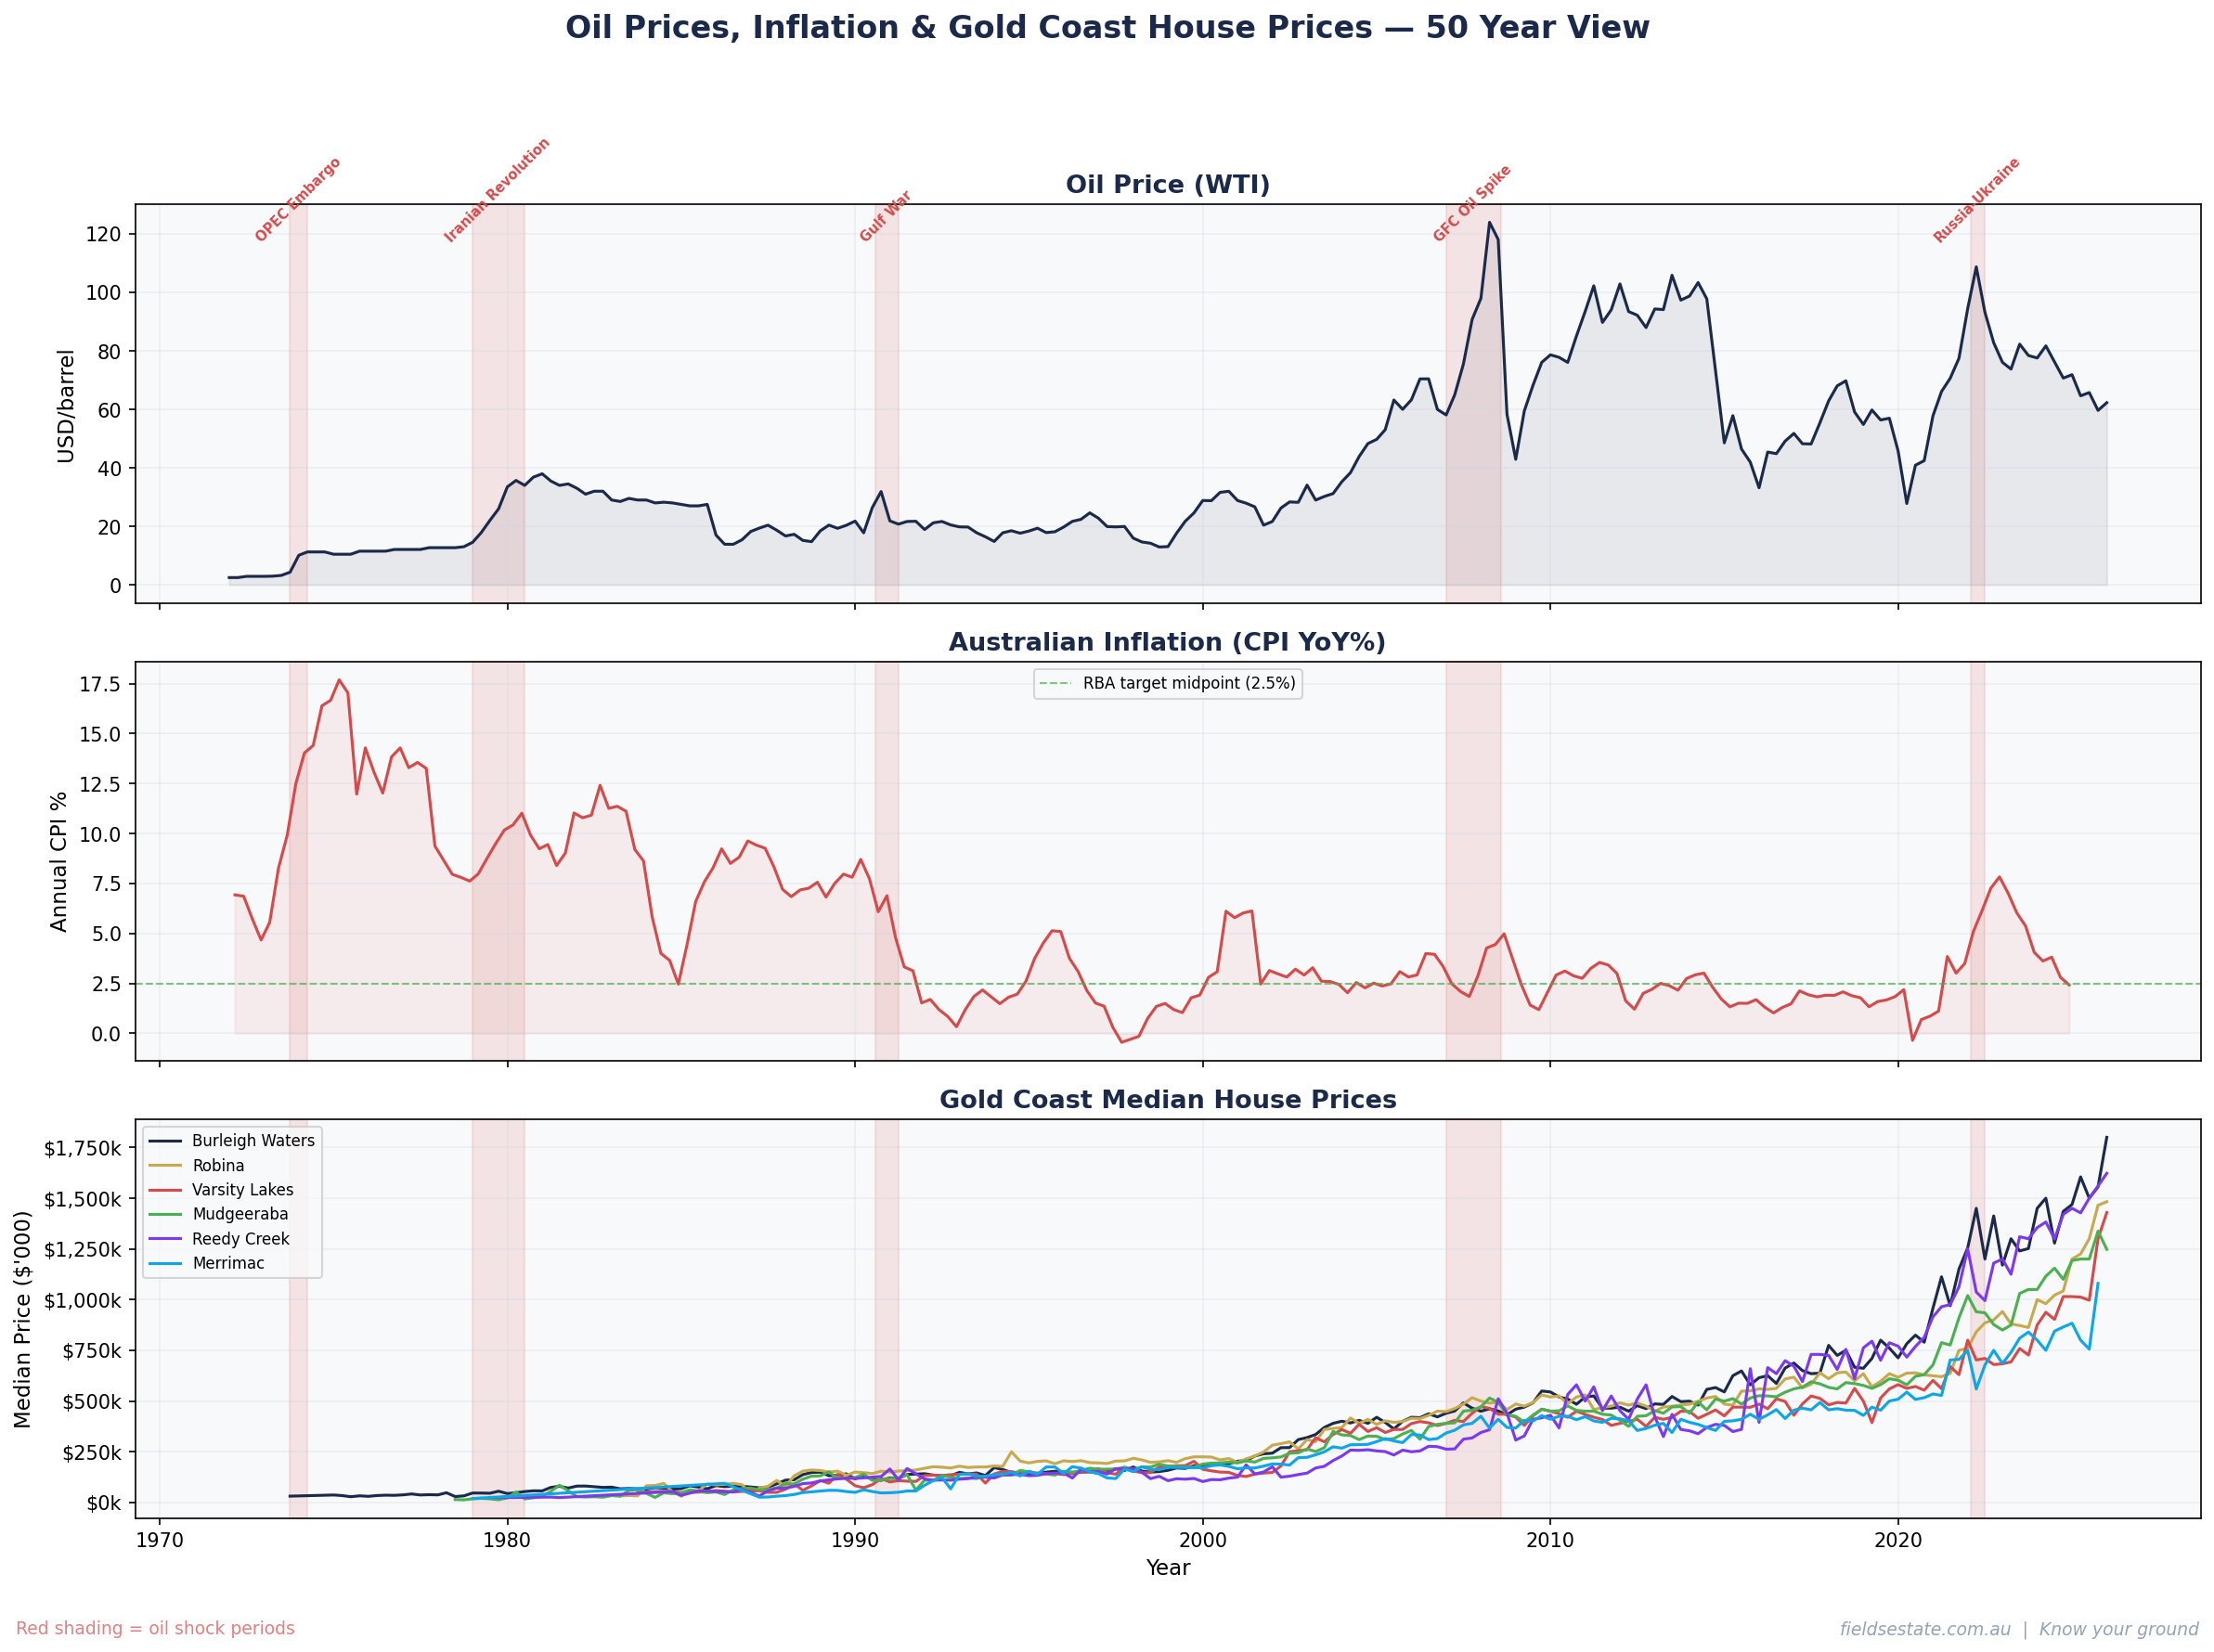
We analysed every major oil shock since 1973, using quarterly median house prices from Burleigh Waters, Robina, Varsity Lakes, Mudgeeraba, Reedy Creek and Merrimac. For each shock, we compared what actually happened to prices against what the pre-shock growth trend predicted. The difference — the “abnormal return” — tells us whether the oil shock moved prices off their normal path.
1. OPEC Embargo (1973–1974) — Oil +275%
The largest oil shock in modern history. Prices tripled. Australian inflation hit 17.7%. The RBA pushed rates from 6.25% to 9.50%.
Burleigh Waters was the only Gold Coast suburb with data this far back. The median house price was $31,200 before the shock. Twelve months later, it was up 18.3% — running 11 percentage points above the suburb’s normal growth trend.
Property acted as an inflation hedge. Nominal asset values rose with everything else.
2. Iranian Revolution (1979–1980) — Oil +191%
Another severe shock. Oil nearly tripled again. Australian inflation reached 12.4%. The RBA eventually pushed rates to 14.50% — the sharpest rate response of any oil shock in our dataset.
The results were mixed. Burleigh Waters dipped 5.9% over 12 months — about 11 percentage points below its normal trend. But it recovered within 18 months and was up 22.3% by the two-year mark. Mudgeeraba, still a developing suburb at the time, gained 25% over the year.
This was the one case where the full transmission chain completed: a massive oil shock drove severe inflation, which triggered aggressive rate hikes, which temporarily slowed prices. Even then, the effect was short-lived.
3. Gulf War (1990–1991) — Oil +21%
Iraq invaded Kuwait. Oil jumped, but only by 21% — far less dramatic than the 1970s shocks. Inflation was already elevated at 7.7%, and the RBA held rates at 14.00%.
Burleigh Waters gained 21.7% in the following year — 17 percentage points above trend. Robina gained 12.3%. Varsity Lakes gained 18.1%.
The average across all six suburbs was 18 percentage points below their pre-shock trends, but this was driven almost entirely by two suburbs (Reedy Creek and Mudgeeraba) experiencing localised corrections from the late-1980s boom. The oil shock was a footnote in a much larger story.
4. GFC Oil Spike (2007–2008) — Oil +107%
Oil doubled during the commodity supercycle before the Global Financial Crisis. Australian inflation hit 5.0%. The RBA raised rates by 1 percentage point.
This was the oil shock that should have hurt. Instead, Gold Coast prices were remarkably resilient. Robina gained 11.6%. Varsity Lakes gained 21.2%. Burleigh Waters gained 2.2% — the softest performer, but still positive.
Across all six suburbs, prices ran 6.3 percentage points above their expected trend. The GFC crash, when it came, was driven by credit markets — not oil.
5. Russia-Ukraine (2022) — Oil +15%
Russia invaded Ukraine. Oil prices rose modestly — just 15% at the peak. But Australian inflation spiked to 7.8%, driven by a combination of supply chain disruption, energy costs and post-COVID demand.
The RBA responded with the fastest rate hiking cycle in its history: from 0.10% to 4.35% in 18 months. That is what hit property prices — not the oil shock.
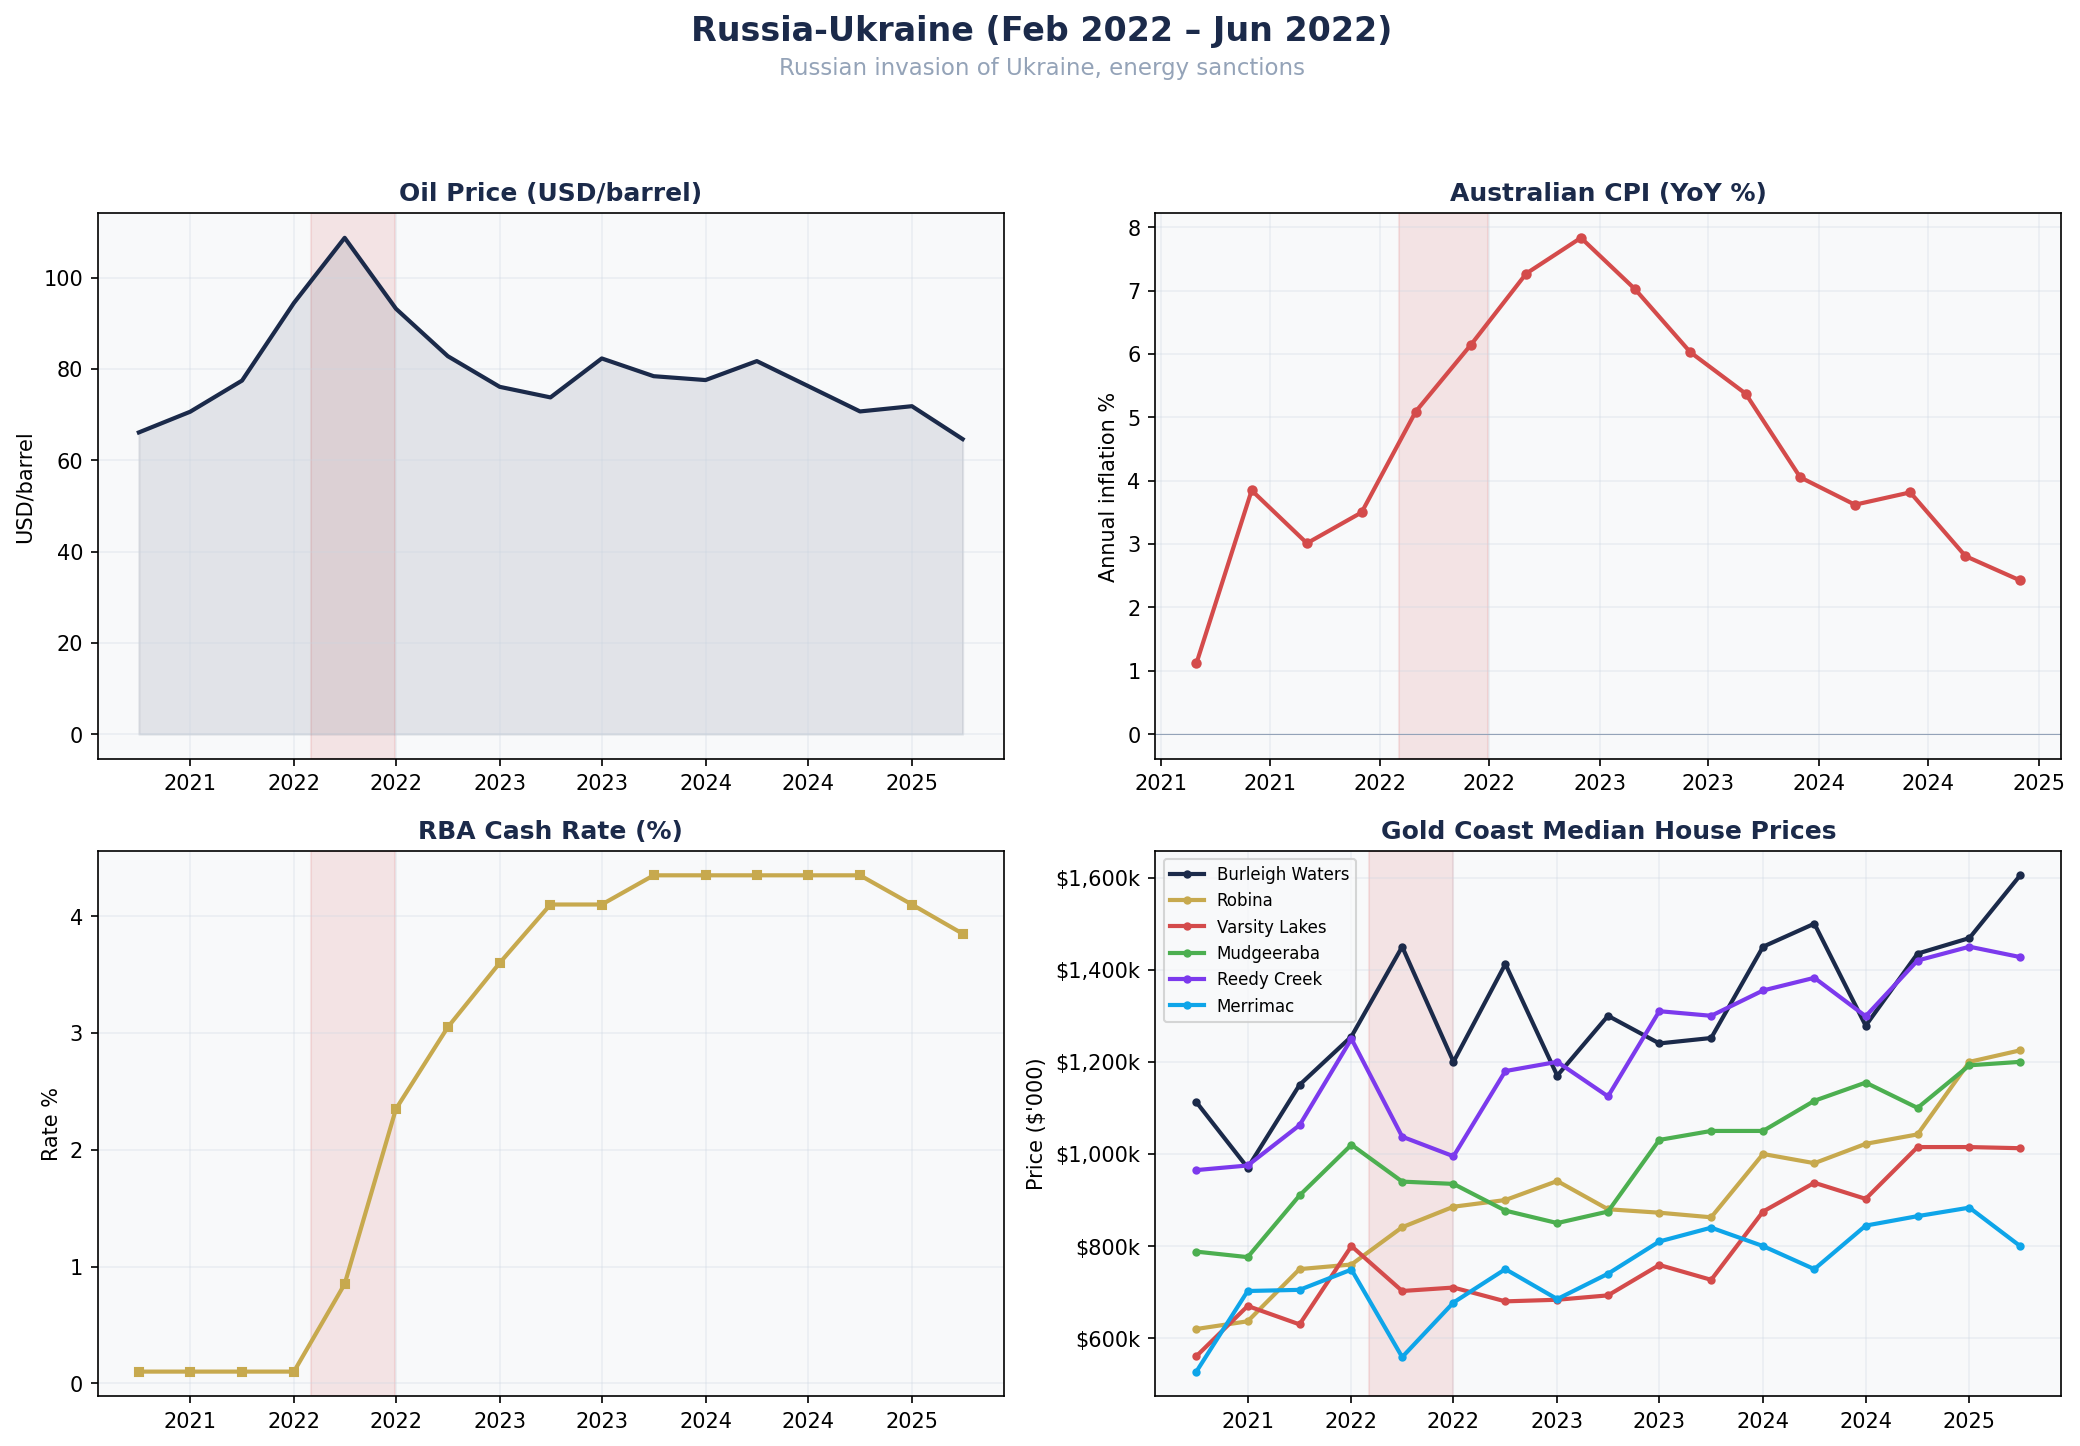
Robina held up well, gaining 15.8% over the following year — running 13 percentage points above trend. Burleigh Waters gained 3.6%, slightly below its normal trajectory. Varsity Lakes dipped 13.4%, finishing 18 percentage points below trend — one of the sharpest negative readings in our entire dataset.
But here is the critical detail: by 24 months, every suburb had recovered. Robina was up 28.9%. Burleigh Waters was up 19.5%. Even Varsity Lakes had bounced back to +17.2%.
Did Oil Shocks Actually Move Prices Off-Trend?
This is the question that matters. Raw price changes after a shock are misleading — they include whatever the market was already doing. To isolate the oil shock effect, we compared each suburb’s actual 12-month price change against what its pre-shock 5-year growth trend predicted.
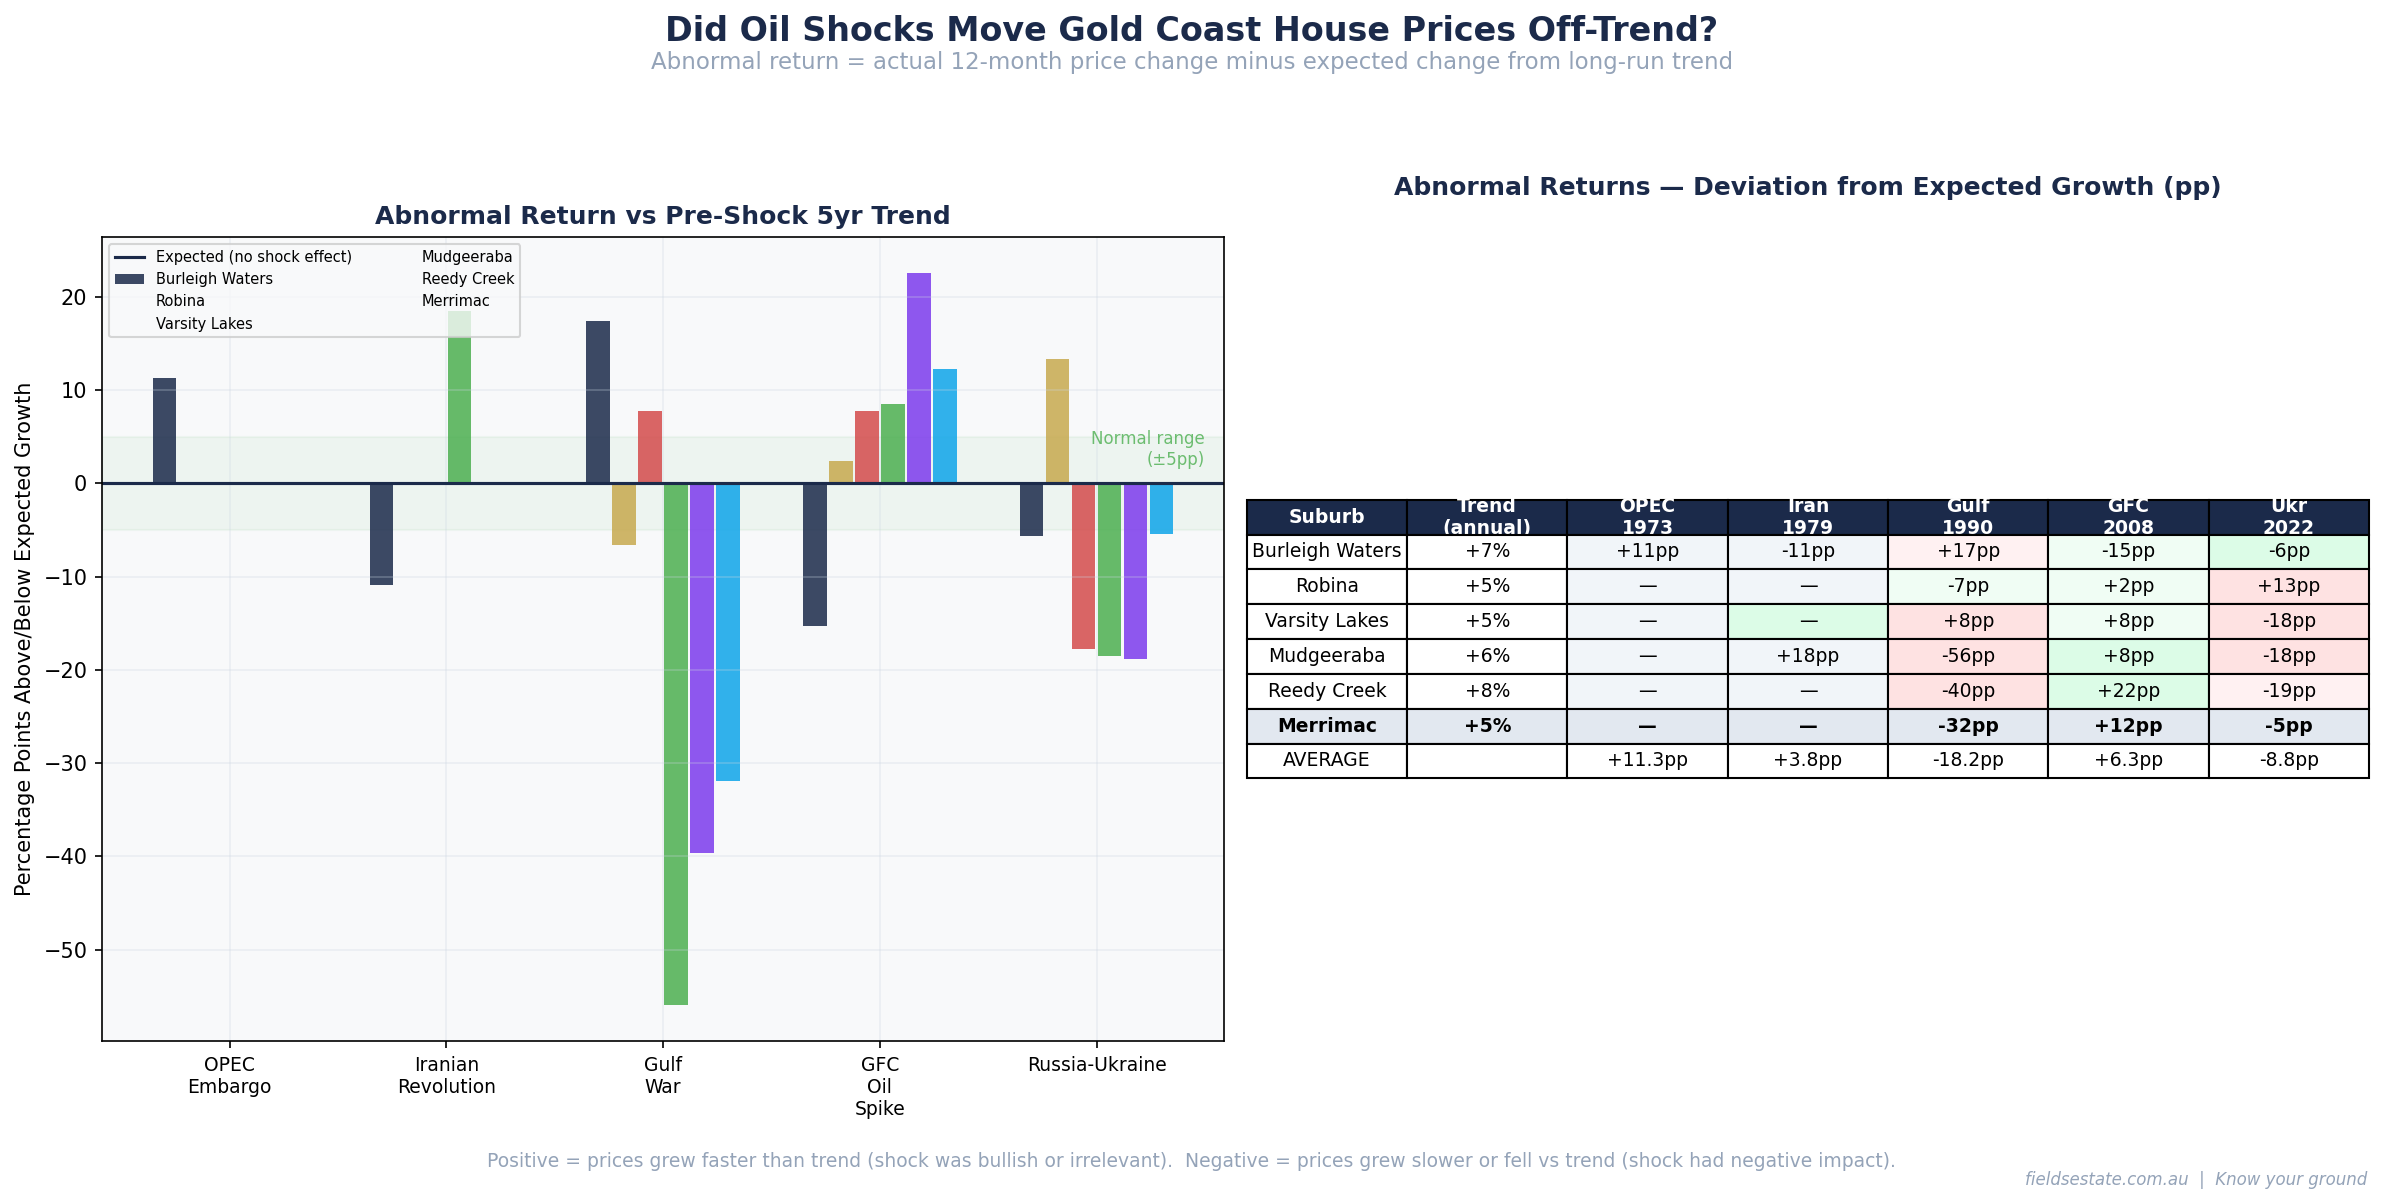
Across 50 years, five oil shocks and six Gold Coast suburbs, we counted 21 suburb-shock observations. Nine showed prices growing faster than their normal trend after the shock. Eleven showed prices growing slower. One was within the normal range.
The grand average abnormal return was -5.0 percentage points. That means, on average, Gold Coast house prices grew about 5 percentage points less than their trend in the 12 months following an oil shock. That is not nothing — but it is far less than the headlines would suggest, and it recovered within 24 months in every case.
More importantly, the two shock periods where prices clearly underperformed — the Gulf War and Russia-Ukraine — both coincided with extreme interest rate environments. In 1990, rates were already at 14%. In 2022, the RBA was hiking at record speed. The oil shocks were contributing factors, not the primary cause.
What This Means for 2026
The US-Iran conflict is real. Oil prices will likely rise. But 50 years of Gold Coast data points to three questions that matter far more than the oil price:
1. Will the RBA raise rates? The cash rate sits at 4.10%. The RBA has been cutting, not hiking. Unless this oil shock drives sustained inflation well above the 2–3% target band, the rate outlook is neutral to favourable. This is fundamentally different from 2022, when rates went from near-zero to 4.35%.
2. How long will the disruption last? Short oil shocks (under six months) have historically had minimal impact on Gold Coast property. The OPEC embargo lasted five months. The Gulf War spike lasted three months. A prolonged, multi-year disruption would be a different story.
3. Will people keep moving to the Gold Coast? Interstate migration is the structural force that has overridden every oil shock in our dataset. People move here for lifestyle, climate and relative affordability compared to Sydney and Melbourne. That calculus does not change because oil goes up.
The Honest Answer
Oil shocks create uncertainty. Uncertainty makes people cautious. Caution can slow transaction volumes in the short term. But the data does not support the idea that oil shocks reliably push Gold Coast house prices down.
Property is a real asset. In inflationary environments, real assets tend to hold or increase in nominal value. The risk is not the oil price — it is the policy response. If the RBA is forced into aggressive rate hikes, borrowing capacity falls, and that is when prices soften. Watch the RBA, not the oil price.
If you are buying on the Gold Coast today, the data says this: the biggest risk is not war or oil. It is overpaying relative to comparable sales in your suburb. That is something you can actually measure and control.
This analysis uses quarterly median house prices from the Gold Coast property database maintained by Fields Estate, cross-referenced with oil price data from the US Federal Reserve (FRED), Australian CPI from the ABS, and RBA cash rate history. Abnormal returns are calculated as the difference between actual 12-month price changes and the local 5-year pre-shock growth trend for each suburb.