Is Now a Good Time to Sell in Burleigh Waters?
**Burleigh Waters house prices have grown +9.1% over the rolling 12 months to a median of $1,800,000. But rising supply, slower clearance times, and a falling absorption rate mean sellers who list today are entering a market that favours patience — not urgency.**

Is Now a Good Time to Sell in Burleigh Waters?
Burleigh Waters house prices have grown +9.1% over the rolling 12 months to a median of $1,800,000. But rising supply, slower clearance times, and a falling absorption rate mean sellers who list today are entering a market that favours patience — not urgency.
That combination deserves an honest look before you decide.
What Your Property Is Worth Right Now
The rolling 12-month median house price in Burleigh Waters is $1,800,000. Twelve months ago it was $1,650,000. Three years ago, $1,485,000. That's a capital gain of approximately $315,000 — or +21.2% — over three years for a typical house owner. The growth has been consistent rather than speculative, which gives it more credibility as a lasting price level.
All figures in this article are for houses only. Units, townhouses, and duplexes are excluded.
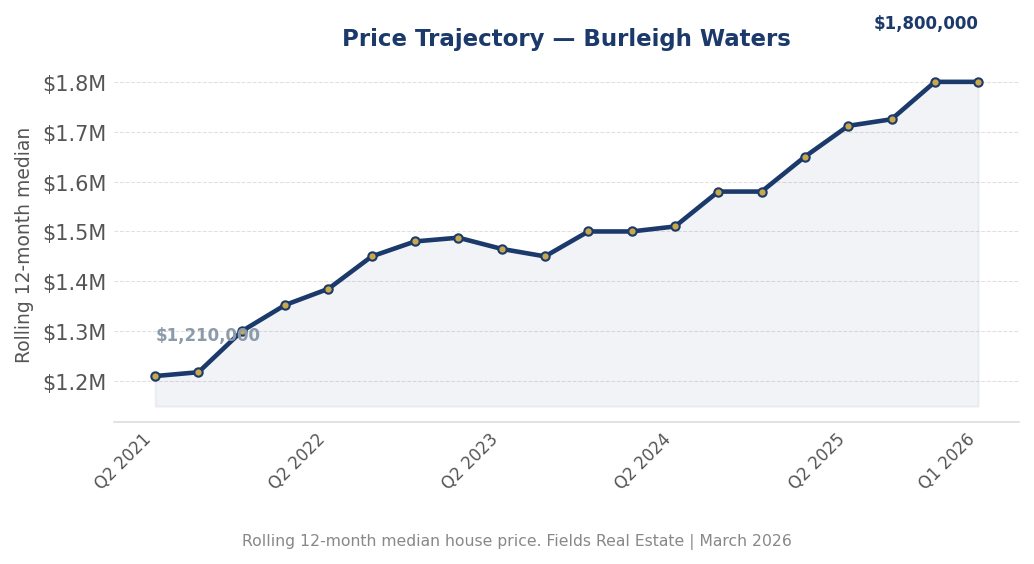
The current cycle phase is expansion. Prices are still moving upward, and the three-year trajectory supports that. But expansion doesn't mean every seller achieves the median — the spread from the lower quartile ($1,480,000) to the upper quartile ($2,300,000) is $820,000 within a single suburb. Land size, street position, aspect, and configuration drive that range. Where your property sits within it matters more than the median alone.
How Fast Properties Are Selling
This is where the data gives sellers a clear message: adjust your expectations.
The rolling 12-month median days on market has risen from 25 days to 41 days — an increase of 16 days. Properties that were clearing in under a month are now taking well over five weeks on average. That shift affects pricing strategy and negotiation position. A vendor who lists at an aspirational price and expects a fast result is likely to be disappointed. The market will test that price, and the longer a property sits, the more leverage moves toward the buyer.
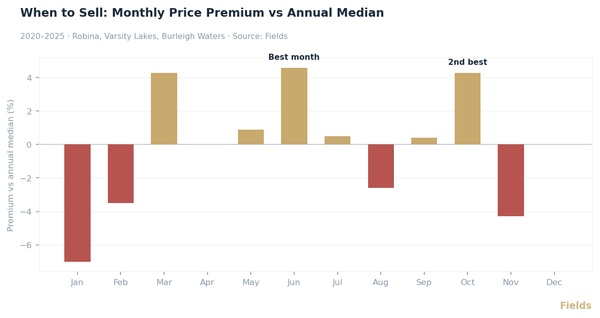
Timing your listing can partially offset this. The best months for faster clearance — based on lowest days on market — are March, April, and June. We are currently in early March 2026. If you are considering listing, the next six to eight weeks represent the most favourable seasonal window of the year.
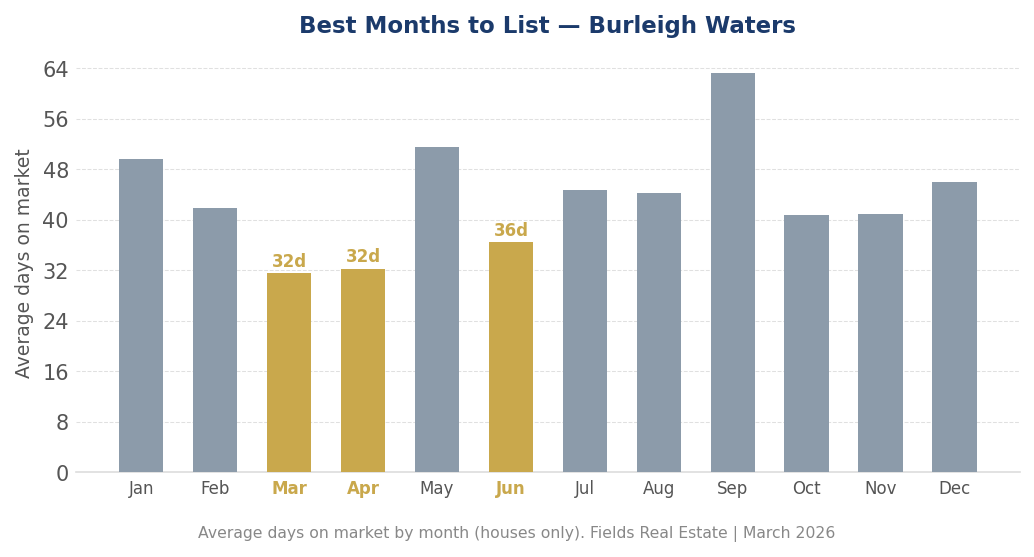
List now, price it correctly from day one, and March through June gives you the best statistical chance of a timely result. List overpriced and wait for the market to catch up — that strategy rarely ends well in a rising-DOM environment.
How Much Competition You're Facing
There are currently 33 active house listings in Burleigh Waters. That number has risen +22.2% over the past three months compared to the prior three months. More sellers are coming to market, and buyer activity has not kept pace.
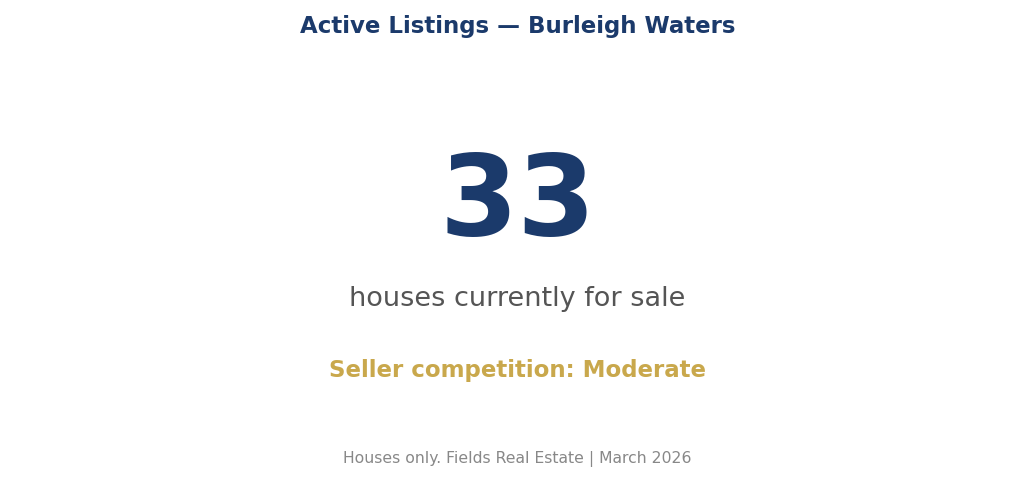
The absorption rate — monthly sales divided by active listings — sits at 0.55. A reading above 1.0 indicates a seller's market. At 0.55, buyers have options. They are not competing for scarce stock; they are choosing from an expanding pool. Sales volume has also eased, falling -5.6% from 232 house transactions in the prior 12 months to 219 in the current period. Fewer transactions, more listings, slower clearance — the competitive position for sellers is rated Moderate, and the seller power reading is Weak.
That doesn't mean you can't achieve a strong price. It means you need to earn it through positioning, not assume it from the market.
What Rate Cuts Mean for Your Sale
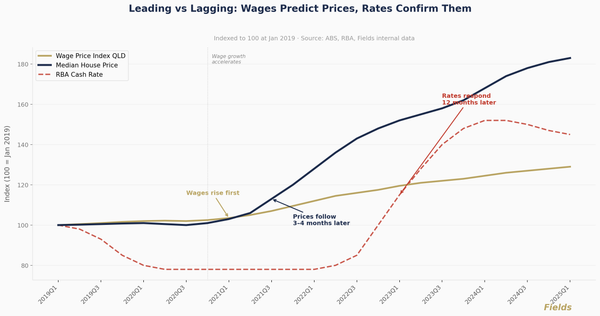
The RBA cut the cash rate by 25 basis points on February 3, 2026, bringing it to 3.85%. Twelve months ago it sat at 4.10%. For sellers, the direction matters: rate cuts increase borrowing capacity for buyers, which expands the pool of qualified purchasers who can meet current asking prices. More buyers able to transact at your price level is a meaningful tailwind.
It's worth noting that the RBA cash rate correlates strongly with Gold Coast prices but lags them by approximately 12 months. The cut reflects conditions that already existed — it is not a reliable predictor of near-term price acceleration. Treat it as a demand-side positive, not a reason to hold out for a premium that may not materialise quickly.
The Honest Answer
The case for selling now: 1. The rolling 12-month median has risen +9.1% — if you've owned for three or more years, you are sitting on substantial capital gains that are real and realisable today. 2. March through June is the strongest seasonal window for days on market. That window opens now. 3. Rate cuts are expanding the buyer pool at current price levels, which supports your ability to transact at or near the median.
The case for waiting: 1. Seller power is currently rated Weak. Rising supply and falling volume mean buyers have leverage. If you can wait for that to rebalance, your negotiating position improves. 2. The absorption rate of 0.55 signals a buyer-favoured market. More listings are arriving each month, and if that trend continues, competition among sellers will increase before it eases. 3. Days on market have risen sharply — from 25 to 41 days. A slower market tests vendor resolve and pricing discipline. If your circumstances require a quick or clean result, the current conditions make that harder to achieve.
The data doesn't make a compelling case for rushing. If your personal circumstances support it, listing during the March–April seasonal window — priced accurately from the outset — gives you the best available combination of timing and conditions. If you have flexibility, monitoring supply levels over the next two quarters before committing is a reasonable approach.
Analysis based on 219 confirmed house sales from the Gold_Coast.burleigh_waters database. All figures are for houses only. Last reviewed: 2026-03-05. Fields Real Estate | Southern Gold Coast.
Disclaimer: The information in this article is for general informational purposes only and does not constitute financial, investment, or valuation advice. Fields Real Estate (Licence No. 4832971) makes no warranty as to the accuracy or currency of data published. Readers should conduct their own due diligence and seek independent professional advice before making any property or investment decision. Read our full disclaimer →