Gold Coast Interstate Migration — What It Means for Southern Gold Coast Home Values
The migration wave that doubled Gold Coast property values wasn't a once-in-a-generation anomaly. It was four decades of structural flow, compressed into five years — and it's still running.

Gold Coast Interstate Migration — What It Means for Southern Gold Coast Home Values
The migration wave that doubled Gold Coast property values wasn't a once-in-a-generation anomaly. It was four decades of structural flow, compressed into five years — and it's still running.
Picture this. A family from the Northern Beaches of Sydney lists their three-bedroom home in mid-2021. They've owned it since 2012. The sale clears $2.4 million. They put $1.5 million on a four-bedroom in Robina — a suburb they'd visited twice on holiday, liked, and Googled for three months — and still bank over $800,000 in change.
They weren't speculating. They weren't investors. They were buying a life upgrade at a price that, by their reference point, seemed almost irresponsible not to take.
That family — or a version of them — drove tens of thousands of individual purchase decisions across the Gold Coast between 2020 and 2024. And those purchase decisions are why your home is worth what it is today.
This is not a story about where house prices went. It is a story about who drove them there — and whether those people are still coming.
The Scale of What Happened
Between 2019 and 2024, the Gold Coast added 68,000 people — the equivalent of relocating the entire population of Rockhampton onto the Coast in five years. The headline figure comes from KPMG's SEQ population analysis, which also found that South East Queensland's population has now reached 4 million and is on track to hit 5 million within the decade.1
Queensland has recorded positive net interstate migration in every single year since the early 1980s. More than four decades. Not a single year of net outflow. That is the baseline.2
What COVID did was turn a steady structural current into a flood. In 2021–22, Queensland recorded net interstate migration of approximately 50,000 people — more than any other state by a wide margin. NSW and Victoria were losing residents at the same rate Queensland was gaining them. The dynamic was straightforward: remote work removed the constraint tying people to Sydney and Melbourne offices, and the Gold Coast was the obvious answer.
That surge has since moderated. Queensland's net interstate migration fell from approximately 29,910 in 2023–24 to a preliminary estimate of 21,595 in 2024–25 — a drop of roughly 28%, according to ABS National, State and Territory Population data.3 These 2024–25 figures are preliminary and subject to revision, as they are based on propensity model outputs rather than finalised migration outcomes.4 In 2024–25, Queensland and Western Australia were the only states and territories with positive net interstate migration; every other state and both territories recorded net outflows.3
But here is the part the headlines mostly missed: as interstate migration normalised, overseas migration replaced it as the dominant driver. In 2023–24, 77% of the Gold Coast's growth came from overseas migration, not from Australians moving north.5 And within that overseas figure, New Zealand has become a pipeline that most Gold Coast agents aren't watching closely enough.
Net migration from New Zealand to Queensland reached approximately 14,200 people in 2024–25 — a figure that grew almost 80% between 2022–23 and 2024–25, according to ABS overseas migration data.6 More than one-third of all New Zealanders living in Australia reside in Brisbane or the Gold Coast.5 With 211,000 New Zealand visitors arriving at the Gold Coast annually — and those visitors often exploring the suburb they will eventually buy in — the NZ-to-resident pipeline is quiet, consistent, and structurally embedded in how this market works.
Australia's total net overseas migration was 306,000 in 2024–25, down from 429,000 the prior year and well below the record 538,000 in 2022–23.6 Still well above pre-pandemic levels — but normalising. The Centre for Population forecasts national net overseas migration of 260,000 in 2025–26 as visa policy tightens and the temporary migrant population continues to fall.7 The Federal Government's tightening of student visa requirements, increased fees, and introduction of indicative international student caps contributed to the net temporary migrant population falling by 55.4% from its 482,290 peak in 2022–23 to 215,160 in 2024–25.6 Queensland's share of that national overseas migration figure was approximately 55,750 persons in 2024–25, with New Zealand contributing the single largest source country component.3
The Gold Coast specifically was one of the fastest-growing areas in regional Australia in 2023–24, recording population growth of 2.3%.5 Over the past decade, the Gold Coast has grown at over 2.5% annually since 2002, accounting for just over half of regional Queensland's growth alongside the Sunshine Coast.5 Updated Gold Coast sub-state population figures for 2024–25 are not yet available — the ABS Regional Population release covering that period is scheduled for 31 March 2026.7
The Gold Coast added 15,300 people in 2024 alone.5 The wave didn't stop. It changed shape.
Who They Are and Where They Came From
The data on where Gold Coast buyers actually originate is more specific than people realise.
In July 2023, 40.4% of properties listed for sale on the Gold Coast were being browsed by interstate buyers — the highest proportion of any city in Australia, according to Little Hinges, which analysed more than 350,000 virtual property inspections. Twenty percent of those interstate inspectors were from New South Wales. Fifteen percent were from Victoria.
At the national level, Sydney accounts for 29% of all outbound metro moving enquiries, and Melbourne accounts for 28%, according to Muval data on removalist bookings. Those two cities are — between them — responsible for more than half of the people actively planning to relocate anywhere in Australia. A large proportion of that outbound flow points north.
The specific feeder zones are worth naming because they explain the particular character of Gold Coast buyers during this period. Northern Rivers, Byron Bay, Newcastle, Central Coast, Geelong — people already living near the coast, already oriented toward lifestyle over city density, using the Gold Coast as the next step in a journey that began with a regional tree-change. These weren't people arriving cold from the CBD. They were people who had already made one move toward this kind of life, and were making another.
That human profile — lifestyle-motivated, coastal-origin, carrying the equity of markets that moved hard between 2015 and 2022 — is the buyer who outbid local Gold Coast families throughout this period. And they're not gone. They're slower. More selective. But still arriving.
The Centre for Population also notes that faster ageing will increasingly drive a separate channel: interstate retirees migrating to coastal areas like the Gold Coast for warmer climate and lifestyle change.7 This demographic skews toward higher equity holdings and lower sensitivity to borrowing costs — a buyer profile that tends to act on fundamentals, not rates.
Where the Migration Pressure Landed — The Geography of the Surge
Migration didn't arrive uniformly across the Gold Coast. Different buyer types went to different zones, and the price data from our database of 51 Gold Coast suburbs shows exactly where each wave hit hardest.
The southern border suburbs — Coolangatta, Currumbin, Palm Beach, Elanora — absorbed a specific buyer: the Northern Rivers and Byron Bay escapee, priced out of their original relocation destination and stepping just across the Queensland border to get there. Coolangatta median prices have grown 79.5% from our indexed baseline. Currumbin is up 211.5%. Elanora is up 162.5%. Palm Beach, up 88%.
Currumbin Waters is the starkest illustration: $630,000 median in 2019. $2,075,000 in 2025. A gain of 229% in six years. The hypothesis holds — proximity to the NSW border, combined with the lifestyle character of the Currumbin Valley, made these suburbs the first landing point for the Northern Rivers-priced-out buyer who wanted Queensland without the Gold Coast price tag. That premium no longer exists, but the growth it produced is permanently embedded in valuations.
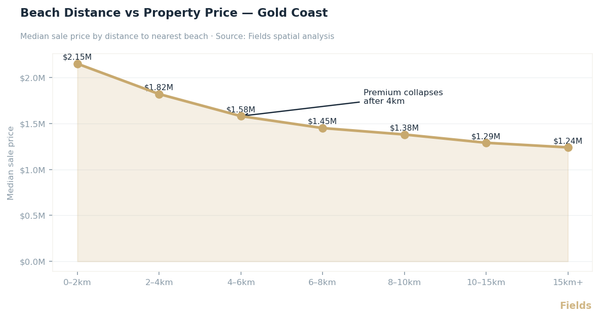
The Southern Gold Coast — Robina, Burleigh Waters, Varsity Lakes, Reedy Creek — attracted the more capitalised interstate buyer: Sydney and Melbourne couples with $2–3 million in equity looking for a four-bedroom house with a pool and school access, within 20 minutes of the beach. That demographic drove median price growth of approximately 167% in this zone from our indexed baseline.
Further north, the Central Gold Coast — Mermaid Beach, Broadbeach Waters, Surfers Paradise — averaged 204% growth, driven partly by overseas migration and premium international demand.
The hinterland suburbs absorbed the buyer most often ignored in analysis: the equity-rich Sydneysider who didn't want a suburb at all. Mudgeeraba, Tallebudgera Valley, Wongawallan, Worongary. These are the "sold in Manly for $4 million and bought 5 acres" buyers — and the price growth they drove is extraordinary. Hinterland suburbs averaged 362% total growth in our indexed series. Worongary was up 24.6% year-on-year as of early 2026. Wongawallan up 21.3%. The hinterland is not priced in to most buyers' thinking yet — and that lag is showing up in the growth rates.
What Our Data Shows in the Suburbs You Actually Know
This is where aggregate statistics give way to the specific transaction record.
Our analysis of 2,147 sales across eight Southern Gold Coast suburbs, sourced from our internal database as of February 2026, gives a suburb-by-suburb picture that the usual reported figures don't capture.
The current market:
| Suburb | Sales (12 months) | Median Price | YoY Change |
|---|---|---|---|
| Burleigh Waters | 241 | $1,700,000 | +9.5% |
| Reedy Creek | 277 | $1,465,000 | -0.6% |
| Robina | 287 | $1,405,000 | +7.1% |
| Varsity Lakes | 275 | $1,220,000 | +9.2% |
| Mudgeeraba | 278 | $1,250,000 | +2.7% |
| Worongary | 253 | $1,255,000 | +3.7% |
| Carrara | 264 | $1,161,250 | +8.6% |
| Merrimac | 272 | $880,000 | +13.2% |
Source: Fields internal data, 2,147 transactions, February 2026. All figures cover houses only. Medians reflect rolling 12-month period to February 2026.
The four-bedroom story is sharper: Burleigh Waters sits at $1,937,500 median for four bedrooms. Robina at $1,510,000. Varsity Lakes at $1,315,000. Carrara at $1,272,500.
For the Sydney family deciding between $2.4 million in Mosman and $1.5 million in Robina, the equation still closes. The gap has narrowed. It hasn't closed.
How fast is it selling:
From our transaction data, cleaned by removing duplicate records and applying standard outlier protocols to each quarter, the current days-on-market picture is as follows.
Robina and Varsity Lakes are the most resilient. Both are moving at a median of 20 days in Q4 2025 — only 5 to 9 days slower than their fastest point in 2024. A home selling in three weeks is not a slow market. Mudgeeraba and Carrara are at 22–23 days — firm, unhurried, but not distressed.
Burleigh Waters is the most notable shift: median days on market extended from 12 days in early 2024 to 40 days in Q4 2025. That 40-day figure is worth contextualising. Burleigh Waters' historical average is approximately 43 days. What happened in early 2024 was the anomaly — the extraordinary tightness of a 12-day selling window was the peak of the migration surge, not the baseline. The market hasn't crashed. It has normalised.
The COVID peak, for reference: every suburb in our database was selling at 7–14 days median in late 2021. That was a once-in-a-generation distortion. Using it as a benchmark for what "normal" looks like will mislead any seller who tries.
How far values have come:
From our indexed price series, using late 2019 as the baseline:
- Burleigh Waters: $850,000 → $2,130,000 (+151%) - Merrimac: $515,000 → $1,260,000 (+145%) - Carrara: $604,000 → $1,306,000 (+116%) - Worongary: $900,000 → $1,910,000 (+112%) - Reedy Creek: $840,000 → $1,670,000 (+99%)
Source: Fields internal data, indexed price series, February 2026. All figures cover houses only.
Is the Migration Effect Still Working For You?
The honest answer is: yes, but differently than before.
The structural case for continued demand is not theoretical. Supply on the Gold Coast is near historically thin. Robina — a suburb of approximately 11,700 properties — had 31 homes listed for sale as of February 24, 2026. Thirty-one. The Gold Coast market has been classified as a Strong Seller's market in every single quarter from 2018 through the end of 2025 — not one quarter of relief from the supply side in seven years.
The national housing shortfall compounds this. Apartment completions fell to 177,000 nationally in 2024 against a requirement of 223,000. The 2026–27 completion pipeline is thinner still. The supply problem that underpins Gold Coast values is national in origin, and it is not resolving.
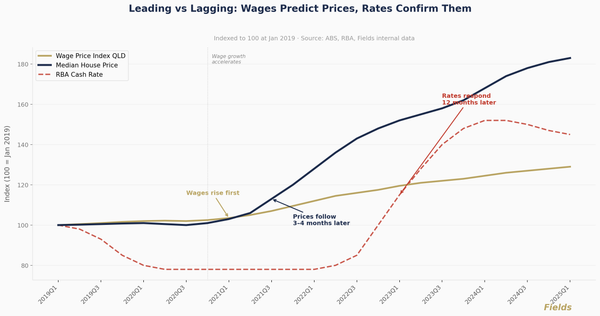
The RBA cut rates to 4.10% in February 2025 — the first cut in the cycle. The buyers who were priced out or who paused during the rate rise cycle are now recalculating. That's a demand tailwind with a lag effect that is still working through the market.
Looking further out: the 2032 Brisbane Olympics infrastructure effect is years from its peak impact on valuations. The Southport, Broadwater, and Carrara Stadium precincts are in active pre-development. Infrastructure of that scale moves prices in the precincts around it — and most of those price impacts arrive five to seven years before the event.
Against this, the headwinds deserve honest acknowledgement. Queensland's preliminary net interstate migration figure of 21,595 in 2024–25 is 28% below the prior year's 29,910.3 The "bargain versus Sydney" narrative weakens slightly every time Robina adds another 7–9% to its median. National net overseas migration peaked at 538,000 in 2022–23 and has fallen to 306,000 in 2024–256 — still well above pre-pandemic levels, but normalising, with the Centre for Population projecting a further fall to 260,000 in 2025–26.7 In 2024–25, the net temporary migrant population decreased by 55.4% from its 2022–23 peak, largely reflecting tighter student visa settings.6 And in Burleigh Waters specifically, the days-on-market extension suggests that some vendor price expectations may have gotten slightly ahead of where the current buyer pool is willing to go.
None of these headwinds reverses the structural argument. They moderate the pace of the story.
What This Means If You're Thinking About Selling
There is a variable that changes everything about the migration effect's impact on your sale — and most agents don't calculate it clearly enough.
The buyers who moved prices in your suburb were not competing against other people from your suburb. They were competing against people from Mosman, Fitzroy, Albany Creek, and Auckland who had a price reference that made your home look like a bargain. That dynamic still exists. It is less intense than 2021. But it has not disappeared.
This means that when you go to market, the pool of people who might buy your home is materially larger than a traditional local market would produce. You are not marketing to Southern Gold Coast buyers. You are marketing to everyone who has ever driven up the M1 and thought "I could live here." And that audience — 29% from New South Wales, 15% from Victoria, a meaningful fraction from New Zealand — is still active, still browsing listings from interstate kitchens at night, still running the same equity calculation that brought the Northern Beaches family to Robina.
The suburb-specific signal from our days-on-market data is the most actionable thing we can give you right now:
Robina and Varsity Lakes are still moving fast. Median 20 days. If your property is correctly priced for that market, you will not be waiting long. Burleigh Waters has extended — 40 days — and sellers there should be clear-eyed about whether their pricing reflects the current buyer pool or the one from 18 months ago. Carrara and Mudgeeraba are firm. The migration story in those suburbs is still running. And the hinterland — Worongary, Mudgeeraba's outer fringe, Tallebudgera Valley — remains the least understood and most structurally supported pocket of the entire southern Gold Coast. The buyers who find it, still find it irresistible.
The migration hasn't ended. It has matured. And a mature, sustained migration story — built on four decades of structural flow, reinforced by a falling Australian dollar, an ageing interstate retiree wave, and a New Zealand pipeline growing at 80% over two years — is a more durable foundation for your property's value than the pandemic sugar rush ever was.
Sources
1. KPMG (2025) South East Queensland Population Soars, KPMG Australia. kpmg.com/au 2. Adept Economics (2026) Population Powerhouse: Why Queensland Never Fails to Attract Interstate Migrants…and Kiwis, Adept Economics. adepteconomics.com.au 3. ABS (2025) National, State and Territory Population, June 2025, Australian Bureau of Statistics. abs.gov.au 4. Adept Economics (2026) Queensland and National Population Update to June Quarter 2025, Adept Economics. adepteconomics.com.au 5. Centre for Population (2025) Regional Population, 2023–24, Centre for Population. population.gov.au 6. ABS (2025) Overseas Migration, 2024–25, Australian Bureau of Statistics. abs.gov.au 7. Centre for Population (2026) 2025 Population Statement — Queensland Snapshot, Centre for Population. population.gov.au
Last reviewed: 2 March 2026. All suburb transaction data sourced from Fields internal database. All figures cover houses only. Migration and population data sourced from the Australian Bureau of Statistics and Centre for Population as cited.
Disclaimer: The information in this article is for general informational purposes only and does not constitute financial, investment, or valuation advice. Fields Real Estate (Licence No. 4832971) makes no warranty as to the accuracy or currency of data published. Readers should conduct their own due diligence and seek independent professional advice before making any property or investment decision. Read our full disclaimer →