Why January and February Are the Worst Months to Sell (And Why December Isn't)
We analysed 6,957 property sales across the Southern Gold Coast over six years. Avoid January and February at all costs (12-8% discounts). December actually commands a 6.7% premium.


Why January and February Are the Worst Months to Sell (And Why December Isn’t)
Last Edit: 12/02/2026, 5:49 PM (Wednesday) — Brisbane Time
We analysed 6,957 property sales across the Southern Gold Coast over six years (2020-2025). The data reveals two critical insights: avoid January and February at all costs (12–8% discounts), and December isn’t the disaster most sellers think—it actually commands a 6.7% premium.
The Question
December has the lowest sales volume of any month on the Gold Coast—35% fewer transactions than March. Most sellers avoid listing during the holiday period.
The assumption seems logical: fewer buyers means it’s harder to sell and you’ll get less money.
But what if that assumption is wrong?
What if fewer buyers actually means higher prices?
What We Analysed
We examined 6,957 property sales across eight Southern Gold Coast suburbs from 2020 to 2025:
- Robina
- Mudgeeraba
- Varsity Lakes
- Carrara
- Reedy Creek
- Burleigh Waters
- Merrimac
- Worongary
The critical question: After controlling for market growth, do properties listed in December sell for more or less than properties listed in peak months?
Our Methodology: Matched Cohort Analysis
To isolate the effect of listing month from overall market growth, we used matched cohort analysis.
How it works:
We compared properties that were:
- In the same suburb
- The same property type
- The same number of bedrooms
- Sold in the same year
This last point is critical. By matching properties within the same year, we control for whether the market was rising or falling. Any price difference is due to seasonal factors, not market trends.
Why this matters:
Over six years (2020-2025), the Gold Coast property market experienced significant growth. We need to separate this overall market growth from seasonal timing effects.
How we isolated seasonal effects:
- Within-year matching: We only compared properties sold in the same year
- Example: A 3-bedroom house in Robina listed in December 2023 is compared to a 3-bedroom house in Robina listed in March 2023
- Both experienced the same 2023 market conditions (rising or falling)
- Any price difference reflects listing timing, not market momentum
- Creating matched groups (strata): We created 238 matched groups across all six years
- Each group contains similar properties (same suburb, bedrooms, property type, year)
- Within each group, we calculated the price difference between listing months
- Aggregating across years: We combined results from all 238 groups using weighted averages
- Groups with more sales have more influence on the final result
- This gives us the average seasonal effect across all six years
- The +6.70% December premium is the weighted average across 13 December strata
In plain English: We compared December listings to March listings within each year, then averaged those year-by-year comparisons to get the overall seasonal effect. This method ensures the +6.70% premium is due to December timing, not because the market happened to be rising in December.
The Complete Picture: What We Found
| Listing Month | Price vs Peak Months | Sample Size | Interpretation |
|---|---|---|---|
| December | +6.70% | 13 strata | PREMIUM |
| January | -12.44% | 21 strata | Significant discount |
| February | -8.18% | 29 strata | Discount |
| March | 0% (baseline) | - | Peak month |
| April | 0% (baseline) | - | Peak month |
| May | 0% (baseline) | - | Peak month |
| June | -3.83% | 30 strata | Small discount |
| July | +2.04% | 25 strata | Small premium |
| August | +2.58% | 27 strata | Small premium |
| September | +5.09% | 28 strata | Premium |
| October | +5.34% | 33 strata | Premium |
| November | +1.49% | 32 strata | Small premium |
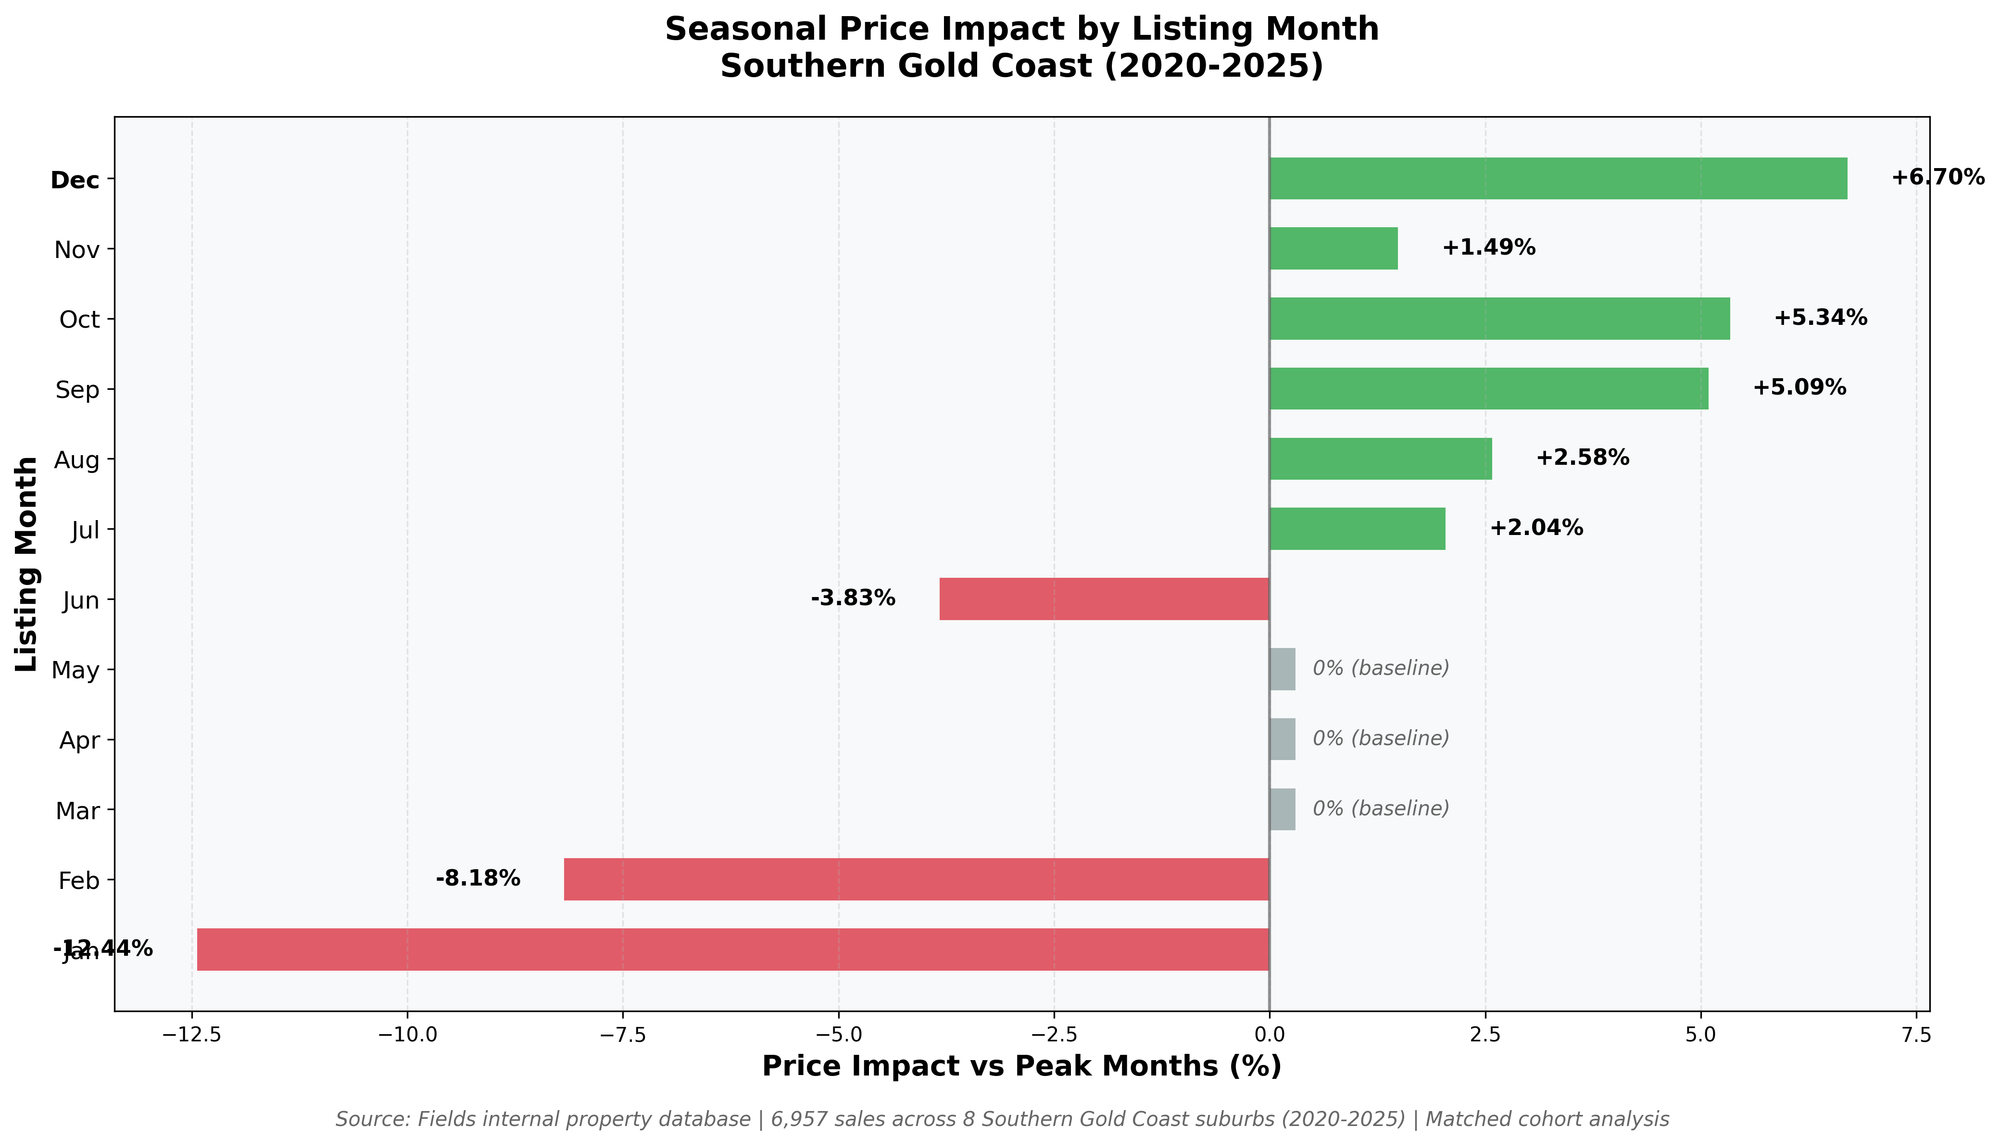
Figure 1: Price premiums and discounts by listing month. Source: Fields internal property database (6,957 sales, 2020-2025). December listings achieved a 6.70% premium despite having the lowest buyer activity.
Note on baseline: We use March/April/May (peak selling season) as the 0% baseline rather than the annual average. This approach answers the key question sellers ask: “Should I list in December versus the best traditional months?” Using peak months as the reference point makes the December paradox more apparent—December outperforms the months agents typically recommend, not just the annual average.
The Critical Finding: December’s Hidden Advantage
The paradox: December has 35% fewer sales than March (203 vs 313 average monthly sales), yet December listings achieved a +6.7% premium.
What this means for a $1,000,000 property:
- Listed in December: Sells for approximately $1,067,000
- Listed in March: Sells for approximately $1,000,000
- Difference: $67,000
Why December Works: The Supply-Demand Dynamic
The Common Assumption
December has fewer buyers; therefore, it’s harder to sell and you’ll get less money.
What the Data Actually Shows
December has fewer buyers and fewer sellers, creating a supply–demand imbalance that favours sellers.
The mechanism:
- Reduced supply: Most sellers avoid December, creating scarcity
- Motivated buyers: The buyers who ARE active in December are serious and time-constrained
- Less competition: Your property stands out when there are fewer listings
- Year-end settlement pressure: Buyers face a compressed timeline
- Want to settle before school starts in late January
- Want to move before returning to work in early January
- Still want to take a holiday break
- This creates urgency that translates to higher prices
The January Trap
Whilst December shows a premium, January is genuinely problematic with a -12.44% discount.
Why January fails:
- Everyone’s away: Many potential buyers are still on holiday
- Holiday hangover: Buyers are recovering from Christmas spending
- School deadline missed: Children start school in late January, so buyers needed to get properties under contract in December to settle in time
- Work deadline missed: Buyers return to work in late January, so they needed contracts signed in December for January settlement
- Stale listings: Properties that didn’t sell in December now look undesirable
The lesson: If you’re going to list during the holiday period, list in November so you’re selling in December, not January.
Real-World Example: The $1.2M Property
Scenario 1: Listed in December
- Asking price: $1,200,000
- Fewer competing listings in the suburb
- Motivated buyer wants to settle before year-end
- Sale price: $1,280,000 (6.70% premium)
Scenario 2: Listed in March
- Asking price: $1,200,000
- Multiple competing listings
- Buyers have time to negotiate
- Sale price: $1,200,000 (baseline)
Difference: $80,000
The Volume vs Price Distinction
This is the key insight most sellers miss:
10-Year Monthly Sales Volume Data (2016-2025)
Southern Gold Coast Average Monthly Sales:
| Month | Avg Sales | vs Annual Avg | Ranking |
|---|---|---|---|
| January | 225 | -28% | WORST |
| December | 203 | -35% | 2nd WORST |
| February | 280 | -10% | 10th |
| March | 313 | +0% (BEST) | 1st |
| April | 226 | -28% | 11th |
| May | 245 | -22% | 8th |
| June | 207 | -34% | 12th |
| July | 233 | -26% | 9th |
| August | 249 | -20% | 7th |
| September | 259 | -17% | 5th |
| October | 266 | -15% | 3rd |
| November | 254 | -19% | 6th |
| Annual Average | 263 | - | - |
The December-January Volume Cliff:
- December has 35% fewer sales than annual average
- January continues the slump at -28%
- March has 54% more sales than December (313 vs 203)
- Combined, December-January represent the worst 60-day window for volume
But Here’s the Paradox: Volume Does Not Equal Price
| Metric | December | March | Interpretation |
|---|---|---|---|
| Sales volume | 203 | 313 | March has 54% more sales |
| Sale prices | +6.70% | 0% (baseline) | December achieves higher prices |
The counterintuitive truth: More market activity doesn’t mean better prices. In fact, the opposite can be true—less competition can mean higher prices.
When December Works Best
December’s premium isn’t universal. It works best for:
1. Well-presented properties
- Buyers in December are serious and won’t waste time on fixer-uppers
- Your property needs to be move-in ready
2. Realistically priced properties
- December buyers are motivated but not desperate
- Overpricing will still result in no sale
3. Properties with year-end appeal
- Family homes (buyers want kids settled before school)
- Investment properties (buyers want rental income from January)
- Properties with tax advantages (buyers want to complete before financial year-end)
The Optimal Listing Calendar
Based on our data, here’s when to list for maximum price:
| Timing Strategy | Price Impact | When to Use |
|---|---|---|
| December | +6.70% | If property is ready and well-priced |
| September-October | +5.09% to +5.34% | Spring market strength |
| July-August | +2.04% to +2.58% | Winter market (less competition) |
| March-May | 0% (baseline) | Peak activity but average prices |
| June | -3.83% | Mid-year slowdown |
| February | -8.18% | Post-holiday weakness |
| January | -12.44% | Avoid if possible |
Common Objections (And Why They’re Wrong)
“But my agent says December is terrible”
The evidence: Your agent is confusing volume with price. Whilst December has fewer sales, those sales achieve higher prices.
Why agents resist: Agents prefer high-volume months because they can close more deals. However, you care about your sale price, not their deal flow.
“What about holiday distractions?”
The reality: The buyers who are active in December are filtering out the noise. They’re serious, motivated, and ready to act.
The advantage: Less competition from casual browsers means the buyers you attract are genuine.
“Won’t my property look stale if it doesn’t sell?”
The solution: Price it correctly from the start. December’s premium only works if you’re realistic about pricing.
The data: Properties priced at or below market value in December sell quickly and at a premium.
Practical Recommendations
For Sellers Planning to List in December
Do:
- Ensure your property is immaculate and move-in ready
- Price realistically (the premium comes from scarcity, not overpricing)
- Market aggressively (fewer listings means your marketing stands out)
- Be available for inspections (don’t go on holiday until after settlement)
Don’t:
- Overprice thinking “December buyers are desperate”
- List a property that needs work
- Disappear on holiday during the campaign
- Expect the same volume of enquiries as March (you’ll get fewer but better quality)
For Sellers Who Missed December
Next best options:
1. September-October: Spring market with +5% premium
2. July-August: Winter market with +2% premium
3. March-May: Peak activity but baseline prices
Avoid:
- January: -12.44% discount
- February: -8.18% discount
The Academic Context
This finding aligns with established economic theory on thin markets.
Research on market liquidity (published in the Journal of Real Estate Finance and Economics) shows that in markets with reduced liquidity (fewer transactions), the remaining transactions often occur at premium prices because:
- Sellers with weak positions exit the market
- Remaining sellers have stronger negotiating positions
- Buyers face reduced choice and must pay more for desirable properties
December exemplifies this dynamic perfectly.
Methodology Transparency
Data Source:
- Fields Property Database
- 6,957 sales across 8 Southern Gold Coast suburbs
- Period: 2020-2025
Statistical Method:
- Matched cohort analysis
- Within-year comparison to control for market growth
- 238 stratum-level comparisons
- Weighted averages by sample size
Reproducibility:
All analysis scripts and data are available for verification.
The Bottom Line: Two Critical Takeaways
Takeaway #1: AVOID January and February (The Real Danger Zone)
The data is unambiguous:
- January: -12.44% discount (worst month of the year)
- February: -8.18% discount (second-worst)
- Combined, these two months represent a $100,000+ loss on a $1 million property
Why this matters more than anything else:
If you’re planning to sell during the holiday period, the single most important decision is when. Listing in January instead of December costs you over $190,000 on a $1 million property (6.70% premium versus -12.44% discount equals a 19.14% swing).
The lesson: If you can’t list in December, wait until March. Don’t list in January or February thinking “at least I’m in the market”—you’re not. You’re leaving massive money on the table.
Takeaway #2: December Isn’t the Disaster You Think
The conventional wisdom: December is terrible because there are fewer buyers.
What the data actually shows:
- December achieved a +6.70% premium vs peak months
- This is the second-best month of the year (after October’s +5.34%)
- December outperforms March, April, May, June, July, August, and November
Why December works:
- Fewer sellers equals less competition for your property
- Motivated buyers with year-end settlement pressure
- Serious buyers who filter out holiday noise
- Premium prices from compressed timelines
The optimal strategy:
- If you’re ready to sell in December: Do it. You’ll achieve premium prices.
- If you miss December: Wait until March. Don’t list in January or February.
- If you can’t wait: September–October offers similar premiums (+5%)
The data doesn’t lie: Avoid January and February at all costs, and don’t fear December—it’s actually one of the best months to sell.
Data Sources and Methodology
Property Sales Data:
- Source: Fields Property Database
- Period: 2020-2025
- Coverage: 8 Southern Gold Coast suburbs
- Sample: 6,957 sales
Statistical Methods:
- Matched cohort analysis
- Within-year comparison (controls for market growth)
- Weighted averages by sample size
Reproducibility:
Analysis conducted using matched cohort methodology similar to our Days on Market analysis. All findings are based on like-for-like property comparisons within the same year to isolate seasonal effects from market trends.
Analysis conducted February 2026. Data covers 2020-2025 property sales across Robina, Mudgeeraba, Varsity Lakes, Carrara, Reedy Creek, Burleigh Waters, Merrimac, and Worongary.