Burleigh Waters Posts a +38.7% Quarterly Surge — the Strongest Single-Quarter Move Across the Corridor
Burleigh Waters recorded a +38.7% QoQ price jump (Q3 2025 → Q4 2025), the sharpest quarterly move across the three tracked suburbs and one of the most significant short-term price accelerations this corridor has seen. With supply compressed to just 1.2 months and a rolling 12-mon

Burleigh Waters Posts a +38.7% Quarterly Surge — the Strongest Single-Quarter Move Across the Corridor
Burleigh Waters recorded a +38.7% QoQ price jump (Q3 2025 → Q4 2025), the sharpest quarterly move across the three tracked suburbs and one of the most significant short-term price accelerations this corridor has seen. With supply compressed to just 1.2 months and a rolling 12-month median house price of $1,880,000, conditions in Burleigh Waters are running well ahead of the broader corridor.
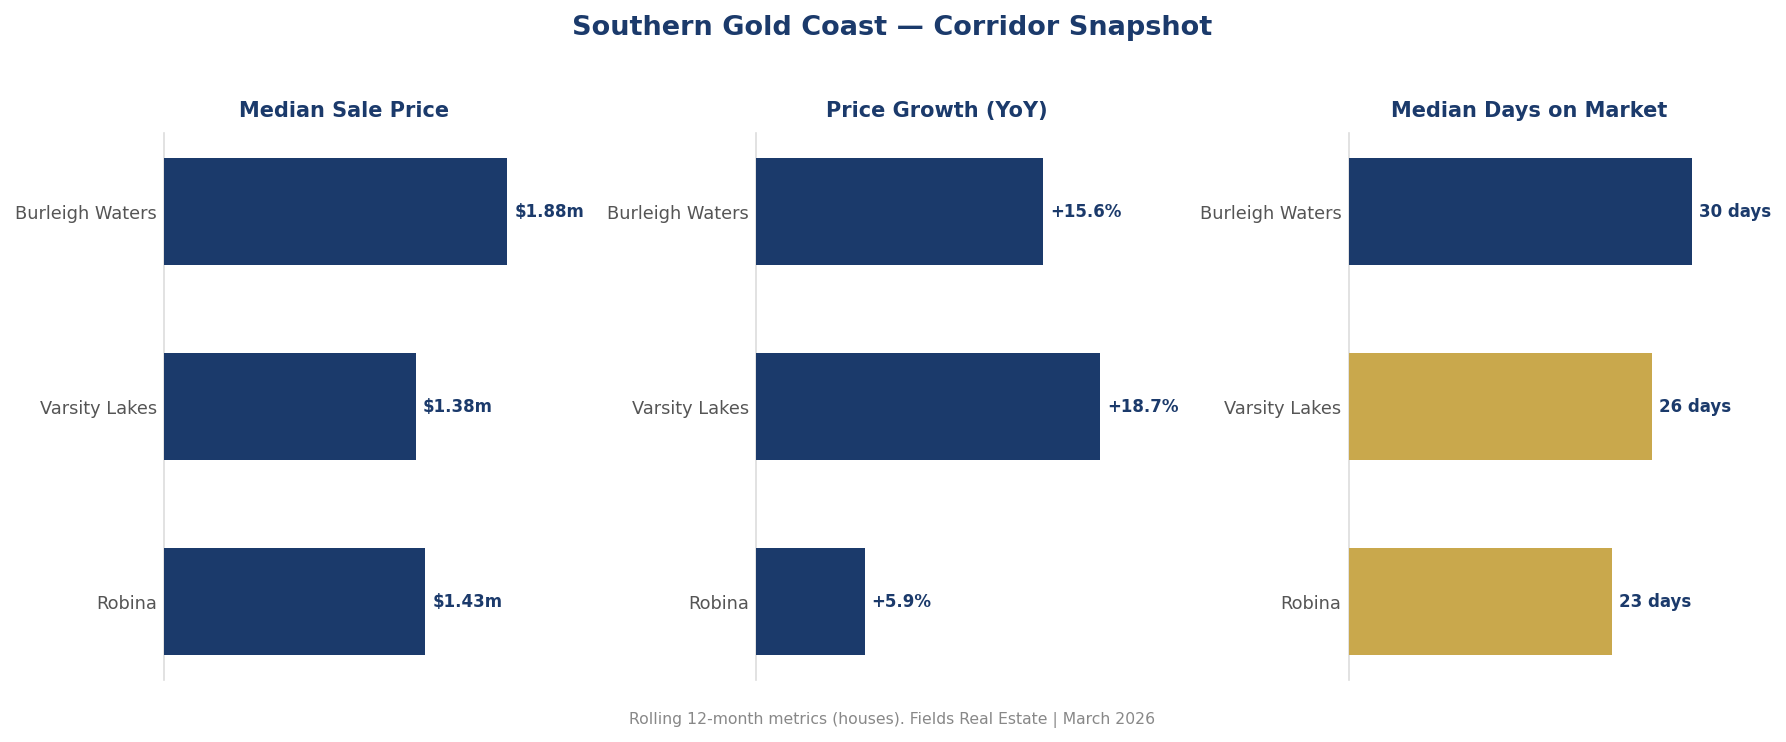
The Corridor at a Glance
All three suburbs are operating in seller's market territory. Months of supply sit between 1.2 and 1.7 across the corridor — well below the 3–4 months typically associated with balanced conditions. Median days on market range from 23 days (Robina) to 30 days (Burleigh Waters), and every suburb recorded 100% of houses sold within 30 days over the trailing period, with the exception of Burleigh Waters at +40.0%. Rolling 12-month YoY growth ranges from +5.9% (Robina) to +18.7% (Varsity Lakes), with all three suburbs in either Growth or Strong Expansion phase.

The gap between asking prices and automated valuation estimates is notable. In Burleigh Waters, the median asking price of $1,442,500 sits –12.0% below the automated valuation estimate of $1,640,000 — a $197,500 gap. Robina shows a similar pattern: a median asking price of $1,230,000 against an automated valuation estimate of $1,320,000 (-6.8%). This divergence suggests vendors in both suburbs may be pricing conservatively relative to where the market is transacting, which partly explains rapid sale timelines. Stale listings (those sitting beyond 60 days) have risen across the corridor — up +15.9% in Robina, +8.7% in Varsity Lakes, and +17.9% in Burleigh Waters — a signal worth monitoring even in a broadly strong market.
Suburb by Suburb
Robina holds a rolling 12-month median house price of $1,430,000, up +5.9% on the same rolling basis year-on-year. The Q3 2025 → Q4 2025 quarterly comparison adds further context: prices moved +10.0% between those two completed quarters. With 365 house sales over the trailing 12 months (up +4.9% on the prior 12-month period), Robina is the highest-volume suburb in this corridor by a significant margin. At 23 days on market and 1.7 months of supply, conditions remain firmly in the Growth phase, though the 1.7-month supply reading is the loosest across the three suburbs — still tight by any historical benchmark. The +15.9% rise in stale listings (properties unsold beyond 60 days) is the metric to watch here; it suggests a small cohort of listings is not clearing at the pace the headline numbers imply.
Varsity Lakes recorded the strongest rolling 12-month YoY price growth in the corridor at +18.7%, with a rolling 12-month median house price of $1,380,000. The Q3 2025 → Q4 2025 quarterly comparison shows +4.3% — a more moderate sequential move following what the annual figure implies was a period of sustained upward pressure. The market is classified as Strong Expansion. Supply is tight at 1.3 months, with just 21 active fresh listings. The most significant data point requiring caution is the volume trend: house sales over the trailing 12 months totalled 187, down –27.0% on the prior 12-month period. That sharp volume contraction, in the context of rising prices, points to a supply-starved market rather than softening demand — but it does mean conclusions from any single quarterly reading carry greater uncertainty.
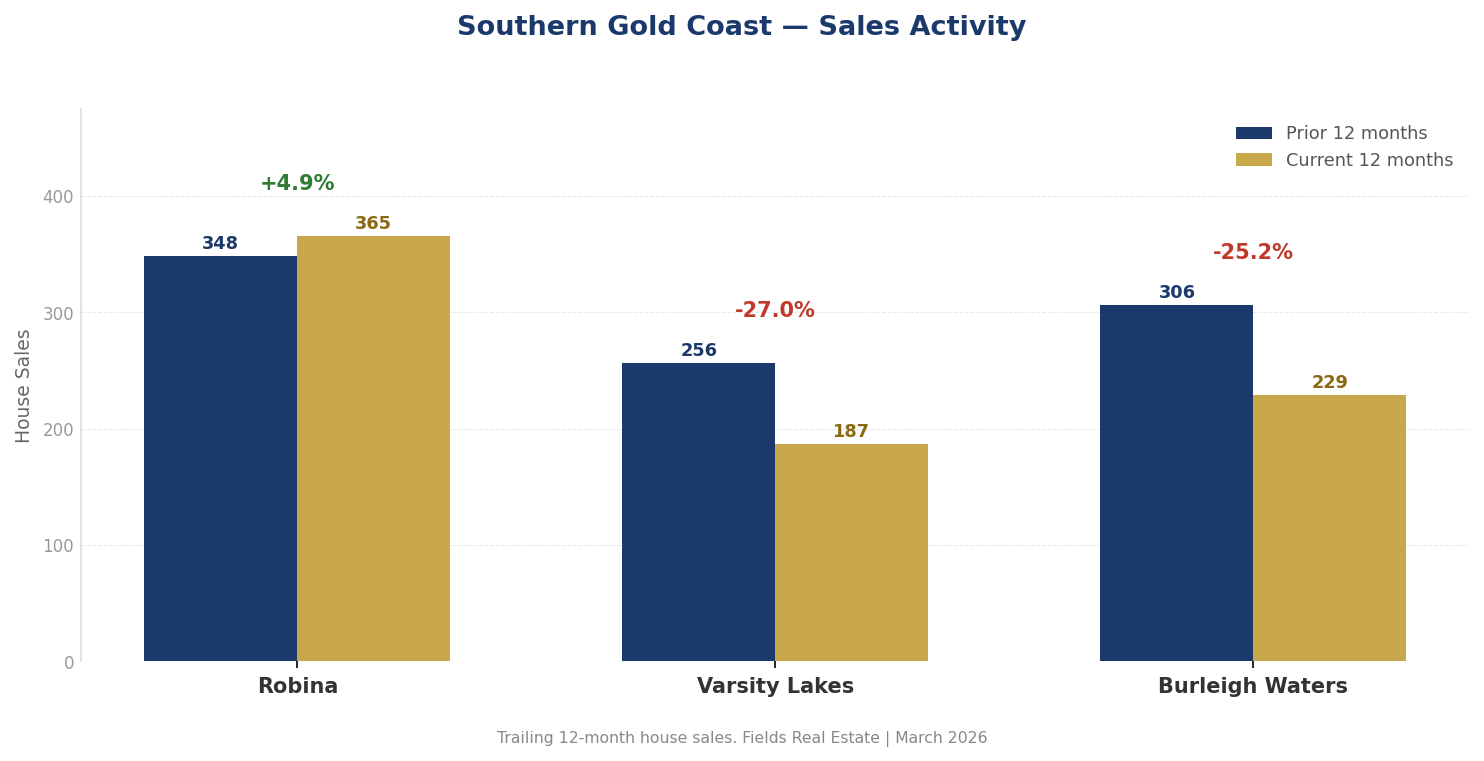
Burleigh Waters is the corridor's headline story this month. The rolling 12-month median house price stands at $1,880,000 — $500,000 above Robina and $500,000 above Varsity Lakes — up +15.6% on a rolling 12-month YoY basis. The Q3 2025 → Q4 2025 quarterly comparison produced a +38.7% price movement across 229 house sales over the trailing 12 months, though volume is down –25.2% on the prior 12-month period. As with Varsity Lakes, a falling transaction count alongside rising prices is characteristic of supply constraint rather than demand deterioration. Supply sits at just 1.2 months — the tightest in the corridor. The +38.7% QoQ figure is unusually large for a single quarter; readers should note that large quarterly swings can reflect a shift in the composition of sales (e.g. a concentration of higher-value transactions) as much as a uniform market-wide price move, particularly when trailing 12-month volumes have contracted. The rolling 12-month median of +15.6% provides a more stable signal.
For Buyers
Robina presents the most accessible entry point in the corridor. At a rolling 12-month median house price of $1,430,000 — $450,000 below Burleigh Waters and $50,000 above Varsity Lakes — it also offers the deepest transaction pool: 365 house sales over the trailing 12 months give buyers the most data points to benchmark value and the best odds of finding available stock. At 1.7 months of supply and a median of 23 days on market, Robina is not a soft market, but it is the least compressed of the three suburbs. The +15.9% rise in stale listings also suggests that a subset of properties is sitting long enough for buyers to negotiate.
Varsity Lakes warrants attention for buyers who can absorb a thinner supply environment. The rolling 12-month median of $1,380,000 is the lowest in the corridor, and despite the +18.7% YoY growth, the absence of a median asking price figure in current data makes it harder to assess current vendor price expectations directly. With only 21 fresh active listings and 1.3 months of supply, buyer competition for any given property will be acute. Those considering Varsity Lakes should act on listings quickly and ensure their due diligence is prepared in advance.
For Sellers
Burleigh Waters offers the strongest seller leverage in the corridor right now. Supply at 1.2 months, a rolling 12-month YoY growth rate of +15.6%, and a median asking price ($1,442,500) that sits well below the automated valuation estimate ($1,640,000) all point to vendors having room to price more assertively. Days on market at 30 — still fast — and the sharp +38.7% Q4 2025 quarterly result provide a credible pricing conversation for sellers preparing to list. The volume contraction (–25.2% trailing 12 months) means less competition from other sellers, reinforcing leverage.
Varsity Lakes presents a similar dynamic. With only 21 fresh active listings across the suburb and a –27.0% decline in trailing 12-month house sales volume, sellers face minimal competition. The market's Strong Expansion classification and +18.7% rolling YoY growth give sellers a strong data foundation when setting price expectations. Any vendor who has held in Varsity Lakes for multiple years will find that current conditions — tight supply, rapid absorption, strong price momentum — represent a favourable window.
What to Watch
Robina: Monitor whether the +15.9% rise in stale listings continues to build — if it does, it may signal that a portion of asking prices are moving ahead of where buyers are willing to transact.
Varsity Lakes: Watch trailing 12-month sales volume; if the –27.0% volume decline deepens further, price readings will become increasingly sensitive to the composition of the small transaction pool.
Burleigh Waters: Track whether the +38.7% QoQ price movement is sustained in Q1 2026 data — a result of that magnitude warrants confirmation across a subsequent quarter before treating it as a durable trend.
Fields monitors price movements, days on market, and supply conditions across the Southern Gold Coast corridor weekly. Data sourced from Fields internal database.
Disclaimer: The information in this article is for general informational purposes only and does not constitute financial, investment, or valuation advice. Fields Real Estate (Licence No. 4832971) makes no warranty as to the accuracy or currency of data published. Readers should conduct their own due diligence and seek independent professional advice before making any property or investment decision. Read our full disclaimer →